AJ Bell: A low-cost investment platform that is taking market share.
Overview
AJ Bell is an investment platform company serving both advised and direct-to-consumer (DTC) customers. Founded in 1995 by Andy Bell, it is now one of the UK’s largest investment platforms, serving over 528,000 customers.
Investment Summary
I think that AJ Bell is a really interesting business operating in a growing end market. Unfortunately, I think this is currently reflected in the valuation and therefore now is not the time to buy it. As is often the case I only realised this at the end of my research so while I do not consider it a buy at this price, the analysis of the company remains relevant.
The UK investment and savings industry is supported by various long-term structural tailwinds. These include the increased uptake in personal pensions and their change to defined contribution, the increased usage of ISA’s, the growing savings gap, and the high levels of UK residents with significant cash savings.
AJ Bell occupies a particular niche within this market, with a focus on providing low fee investing on an easy-to-use platform. This has allowed it to continue to take market share on an organic basis. I believe this highlights the strength of its offering and its increasing relevance for fee conscious investors. Other platforms have recognised this and have sought to reduce their fees, but reputation and operational efficiency have proved to be stumbling blocks.
Moreover, platforms are sticky, insofar as moving investments between them can be complicated. Platforms have set up services designed to manage this process for investors, but this still represents a significant switching cost for customers. This means that once an investor has chosen a platform, they are likely to stick to it. This gives AJ Bell a source of revenue that is recurring, and in the case of ad valorem charges, grows as the assets under management do.
Investment platforms also exhibit operational gearing. Developing a platform requires high initial fixed cost investments, but thereafter the incremental cost of providing the service is much lower. This effect is somewhat muted for AJ Bell currently, but I think it will become more evident over the coming years for two reasons. The first is that as investment in growth begins to subside, operating expenses should begin to stabilise. The second is that as the company’s AUM grows, and its percentage of revenue generated from ad valorem charges increases, we should see some margin expansion relating to lower variable cost requirements.
The investment platform industry is also beginning to exhibit more attractive dynamics. AJ Bell was established nearly 30 years ago, when the industry was still in its infancy. Few companies had reached any significant scale, and none had brands that carried significant weight. This has changed, and the barriers to entry that didn’t exist then, are becoming more established. Larger firms now have certain advantages, particularly relating to brand and the benefits this has for customer acquisition.
AJ Bell is also cash generative, debt-free and has a countercyclical hedge in the form of interest earned on client cash balances. It’s out-performance during the recent period of economic uncertainty, also points to the fact that its low fee structure makes it an attractive proposition across the economic cycle.
Products
AJ Bell is a low-cost investment platform provider that offers products catering to both the advised and DTC segment of the market. In both cases, these solutions focus on low costs, ease of use, and good customer service.
DIY Customers

AJ Bell
This is AJ Bell’s award winning, flagship platform for DTC customers. It is execution only, so doesn’t provide advice to customers, and is delivered through a mobile app and website. It offers a wide range of different account types including SIPP’s, stocks and shares ISA’s, dealing accounts and cash savings hubs. Listed investments include mainstream retail investments including equities, funds and bonds as well as a selection of guided investment solutions offered by AJ Bell. As this product is execution only, the current user experience is fairly pared back, but AJ Bell makes up for this with a simple interface and low fees.
Dodl
Dodl was developed as an alternative DTC platform to AJ Bell’s main offering. Unlike the main AJ Bell platform, Dodl is only available as an app. Users can set up a variety of different account types, similar to those mentioned above, but they have access to a much more curated selection of investments including AJ Bell funds, themed investments and UK and US equities.
Advised

Investcentre
Investcentre is AJ Bell’s platform for advised customers. It is used by UK FCA regulated advisers and offers the same wide range of accounts that can be found on AJ Bell’s DTC platform. The investment range includes access to regular funds, bonds and equities as well as some of AJ Bell’s own offerings and their low-cost managed portfolio service.
Touch
Touch is AJ Bell’s new advised offering launched this year. It allows advisors to connect with their customers through an app and manage their clients on a simple dashboard. The app can be customised with the advisors branding and offers several benefits to both client and adviser. These include digital task management, integrated banking for easy deposits and secure in-app messaging.
The Market
AJ Bell operates within the UK investment platform market which forms part of the broader UK savings and investment industry. According to Platforum, AUA for both advised and DTC platforms has grown at a CAGR of 11% over the past decade, reaching a total of £912 billion in 2022. The company thinks this represents only 1/3rd of their £3 trillion total addressable market (TAM).
The growth in the group’s TAM has been driven by a number of factors. Firstly, the AUA of the UK investment industry as a whole has continued to grow, reaching a record £9.1 trillion in 2023 according to data from the UK Investment Association. Growth since the 2008 financial crash has also been strong, compounding at 9% annually. The first and most obvious reason for this is that the level of invested assets will naturally compound in value over time.
There are also long-term structural changes taking place within the UK savings and investment industry. One of these is the increase in workplace pension participation from 47% in 2012, to 79% in 2021. This sharp increase was caused primarily by the introduction of automatic enrolment, a policy brought in by the government to address the growing pension savings gap. This is the difference between the amount retirees have for retirement, and the amount they will need. Research by the World Economic Forum predicts that this gap will grow from £6 trillion to £25 trillion by 2050, driven primarily by greater life expectancy.

This increasing savings gap is forcing retirees to take a much more active interest in their pensions and investments. As life expectancy increases, so too does the amount needed for retirement. State pensions, which currently pay out a maximum of £221 per week are insufficient for those wishing to achieve a certain standard of living. The age at which these can be accessed is also set to increase to 67 by 2028, meaning that those wishing to retire before this must place greater focus on their personal pensions.
Personal pensions, unlike state pensions, are voluntary. They can also be accessed at a much younger age, currently 55, and taxable limits on contributions are more flexible. They have subsequently become an attractive vehicle for those looking for a tax efficient source of saving for retirement. This is reflected in the increasing levels of contributions made to personal pensions over the last decade.

Source: Gov UK
Personal pensions have also undergone a significant transition in recent years from defined benefit to defined contribution. Previously, employers paid retirees a guaranteed income during retirement. This has now changed, with employees and employers contributing a certain amount, and the retiree’s income now based on the size of their pension pot at retirement. This has shifted the burden of responsibility onto the retiree, with their retirement income now based on the amount of their contributions and the return these have generated.
ISAs have also impacted the landscape of the UK Saving and Investment Industry. Brought in during 1999 when Gordon Brown was chancellor, they were part of an effort to encourage more people to save. ISAs are tax free savings accounts that allow individuals to save up to £20,000 a year. This can be split between either cash, stocks and shares, innovative finance or lifetime accounts. The scheme has been a success, with the amount subscribed each year and the total market value growing over the past 15 years.

Source: Gov UK

Advances in technology have also helped to democratise investing. Access to platforms, such as AJ Bell’s, have removed barriers to participation for retail investors. This, combined with the rise in low-cost providers and easy access to information, had led to higher levels of participation from retail investors.
Despite this, there is still an educational gap within the UK regarding investing in shares, with just 23% of UK residents owning shares compared to 58% in the US. This has led to bloated levels of cash savings, which Barclays currently estimates at over £430 billion. It also estimates that 38% of the population keep all of their assets in cash and 24% have substantial cash savings (over £10k).
The FCA has set a target to reduce the amount of people with cash savings above £10k by 20% by the end of 2025. This, combined with behavioural changes post pandemic (see the change in the non-pension savings rate below) and an increased propensity for younger people to invest, should help to push assets onto investment platforms.

Historically, a large portion of savings and investments has also been held off platforms by banks, insurance companies and investment managers. This is beginning to change as the advantages offered by platforms, such as increased flexibility, more investment choice, and lower fees, becomes apparent. This has led to assets currently held off-platform being moved onto platforms, a trend that is likely to continue in the future.
Competitive Landscape
AJ Bell operates in a highly competitive industry. The landscape is made up of a combination of large established providers and newer, often zero-cost platforms. Platform providers have very few opportunities for differentiation. The things that matter to customers the most are fees, easy to use platforms, and good customer service. Fees in particular have become an increasingly important topic for investors over the past few years, with the realisation that high costs can significantly eat into investment returns over time. There has subsequently been a trend towards low-cost platform providers in recent years. I believe this trend has benefitted AJ Bell and is reflected in its ability to consistently take market share over the past decade.
Hargreaves Lansdown
Hargreaves Lansdown is the largest investment platform in the UK, with 1.8 million clients and £155 billion in assets under management. It was recently subject to a private equity takeover bid of £5.4bn but has generally performed poorly in recent years. Investors have been concerned for some time about gaps in the digital experience, increasing competition from other low-cost providers, and falling levels of client retention. These problems are exhibited in its falling operating margin, which has declined by 15% in 12 years, and its fall in asset retention, from 91% in 2021 to 88% in 2024.

Chart showing Hargreaves Lansdown’s operating margin between 2012 and 2024.

Chart showing Hargreaves Lansdown’s assets under management between 2012 and 2024.
HL has attempted to mitigate some of these issues, with certain fees reduced of removed entirely, but it is still unable to compete directly with low-cost providers. Its platform fee is almost double that of AJ Bell’s at 0.45%, yet its operating margin is only 7% higher. Customer number growth has also slowed in recent years, pointing to a softening of its competitive position, but it remains the dominant player in the market.

Chart showing Hargreaves Lansdown’s customer numbers between 2012 and 2024.
Abrdn
Abrdn operates in both the investment platform and asset management business. Their platform segment is split between two advisor platforms, Wrap and Elevate, and a DTC platform, Interactive Investor (II), acquired in 2022.
Abrdn has struggled recently, with mixed performance in its platform segment. Their advised platforms have seen net outflows of £2 billion in H1 24, driven by elevated levels of redemptions. Advised AUA has also decreased between 2021 and 2023, a concerning trend given it includes the effects of past acquisitions. The company has chosen to consolidate acquired and existing AUA, a decision which has obscured the underlying performance of each of its platform offerings.
Performance for the groups DTC platform, II, has been better with net inflows of £3.3 billion in H1 2024. Given this is a relatively new acquisition however, it is difficult to draw conclusions at this stage. Its business model is also less attractive as it doesn’t benefit from increased ad valorem revenue as AUA grows.

Chart showing Abrdn’s assets under management between 2012 and 2023.
Customer numbers are only reported by Abrdn from 2019 onwards. That available data does show that growth for both the advised and DTC platforms have been stagnant in recent years, reflecting customer sentiment towards its value proposition.

Chart showing Abrdn’s platform customers between 2019 and 2023 (the only years of data provided).
eToro
eToro is a zero-fee trading and investment platform headquartered in Tel Aviv. Unlike the two platforms above it occupies a slightly different niche, aimed at traders as much as investors due to its zero-fee structure. It provides access to a wide range of different asset classes including stocks, ETF’s and commodities. Whilst it is popular with fee conscious UK investors, all accounts are held in US dollars and customers are charged from any withdrawals and conversions.
AJ Bell
AJ Bell has been disciplined in the execution of its strategy, focusing on providing a low-cost, simple to use investment platform with good customer service. This focus, combined with investor’s increasing awareness of the impact of high fees, has allowed them to continue to take market share.
These measures have allowed them to grow their customer numbers at a CAGR of 19% over the past 12 years. For comparison, Hargreaves Lansdown achieved 13% growth over the same period, an impressive result given its size. Abrdn only began releasing customer numbers in 2019, so it has no comparable period of data available.
Customer growth in the previous three years is where is gets more interesting for AJ Bell, with a CAGR of 13% compared to 5% for HL. Abrdn doesn’t have three years of customer data for its combined adviser and DTC platform but in the past 2 years it has achieved a CAGR of -0.1%. AJ Bell’s performance in recent years is even more impressive given the industry backdrop of high interest rates (which push people towards cash savings accounts) and cost of living pressure (which reduce the level of income people can set aside).

Chart showing AJ Bell’s customer numbers between 2012 and 2024.
AJ Bell’s AUA has also increased significantly throughout this period, growing at a CAGR of 15%. HL’s AUA for the same period was 16% and Abrdn’s 24% (11-year period), although this does include the effects of acquisitions which are significant. Despite the fact that the platform industry is generally measured in AUA, it is not always a good proxy for performance because it is affected by market movements. It also favours larger companies whose asset values compound at higher rates.

Chart showing AJ Bell’s total assets under management, split between the different segments, from 2012 to 2024.
Net inflows, which are gross inflows of assets minus outflows, are a better indicator of platform health and performance than pure AUA growth. This is because they are isolated from the effects of market movements and subsequently give a much clearer picture of the underlying change in client assets.
The below graph shows the annual net inflows for Abrdn, HL and AJ Bell over a 7-year period. As we can see, both Abrdn and HL have seen their levels of net inflows drop during this period. The trend is particularly concerning for Abrdn, whose acquisitions are included in the data. AJ Bell has managed to maintain a consistent level of inflows, particularly during the recent period of market turmoil. AJ Bell has also competed with both Abrdn and HL on absolute terms which, given its smaller size in terms of total AUA, is really impressive. If we look at net inflows as a percentage of total AUA we get a measure of relative performance which puts AJ Bell top for every year bar one.

Chart showing a comparison of the annual net inflows for AJ Bell, Hargreaves Lansdown and Abrdn between 2017 & 2024.

Chart showing a comparison of the relative net inflows for AJ Bell, Hargreaves Lansdown and Abrdn between 2017 & 2024.
As mentioned above, recent net-inflows for the company have been strong. FY 2023 numbers showed that AJ Bell was able to achieve net inflows of £4.2bn in 2023 compared to £4.8bn for Hargreaves Lansdown and £3bn for Abrdn. AJ Bell actually had higher DTC inflows than Hargreaves, but the latter was able to generate £3.2bn from its cash ISA product. The below graph also highlights the resilience provided by the company’s dual-platform offering.

Source: AJ Bell Annual Report
This trend has continued into 2024, with inflows for the first 6-month period remaining strong and outperforming its closest rivals. AJ Bell also significantly outperformed HL’s DTC inflows for this period, but fared equally as well as II, who’s fixed fee structure aligns closely with AJ’s low fees.

Source: AJ Bell Annual Report
Continued growth in customer numbers, and subsequently AUM, has allowed the group to gain market share. The graph below shows the growth in the UK platform market over a 10-year period. The data is taken from AJ Bell’s annual report, but we can use it to compare changes in market share between AJ, Abrdn & HL throughout this period.

Source: AJ Bell Annual Report
If we look at the graph below it shows that Abrdn and HL have both taken more market share than AJ Bell on an absolute basis. This doesn’t give an accurate picture of changes within the competitive landscape however, so we have to dig a little deeper to understand what is happening.

Chart showing the change in market share for AJ Bell, Hargreaves Lansdown and Abrdn between 2012 & 2022.
Firstly, comparing the change between Abrdn’s share of the total market in 2012 and its share in 2022 is misleading as Abrdn didn’t operate in the DTC market until 2021. As such a more like for like comparison would be to look at Abrdn’s share of the advised platform market compared to AJ Bell’s. As the graph below shows, Abrdn has grown its share of the market by 4.89% on an absolute basis, compared to 3.3% for AJ Bell. If we look at the difference between the CAGR for each of them, Abrdn has grown its share of the market by 6% annually compared to 6.2% for AJ Bell, pretty similar.
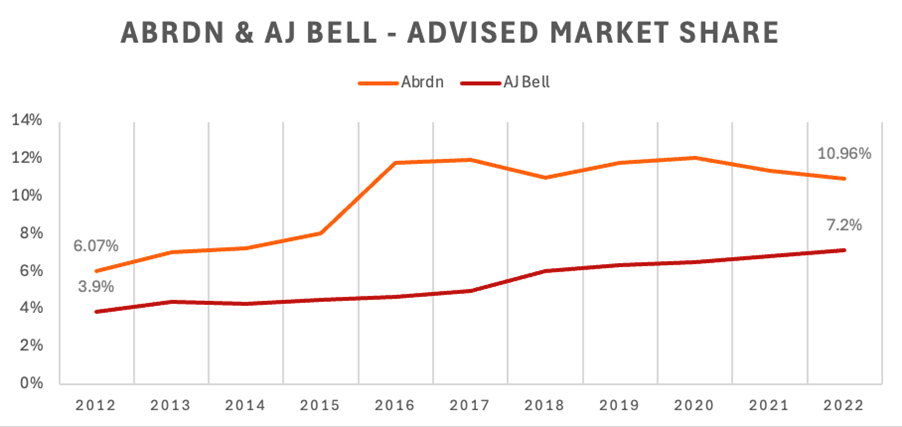
Chart showing a comparison of AJ Bell and Abrdn’s market share gains between 2012 & 2022.
Abrdn’s AUM, however, has been impacted by platform acquisitions it made during this period. This includes Parmenion in 2015 and Elevate in 2016, adding £3bn and £11.3bn respectively to 2016 AUM. Parmenion’s numbers are reported so it is easy to remove these from total advised AUM. This only needs to be done from 2016 through to 2020, when the platform was sold. Elevate is more challenging, with AUM only reported separately during the year of acquisition. If we use the 2016 reported figure of acquired AUM (£11.3bn) and increase this each year by the total growth in advised platform assets excluding Parmenion, we get a rough proxy for organic market share performance.

Chart showing a comparison of AJ Bell and Abrdn’s market share gains, adjusted for acquisitions, between 2012 & 2022.
The graph above shows that, roughly adjusted for the effect of acquisitions, AJ Bell has grown its share of the advised platform market at a faster rate than Abrdn. This indicates that AJ Bell’s advisor platform, Investcentre, offers a more compelling value proposition than Abrdn’s original platform, Wrap. It is worth noting that AJ Bell has made acquisitions throughout this period, but as only one of these was for an investment platform (with no AUA), it doesn’t have any impact on the results above.
AJ Bell’s share of the DTC market has grown at an even more impressive rate than its share of the advised market. Throughout the same 10-year period it has increased its share of the market by 5.4% on an absolute basis, growing at a CAGR of 17.8%. HL is its largest competitor in the DTC market so we will compare its market share to that of AJ Bell’s.

Chart showing a comparison of AJ Bell and Hargreaves Lansdown’s DTC market share gains between 2012 & 2022.
The first thing that is noticeable about the above graph is that HL dominates the DTC market by a significant amount. In fact, based on 2023 numbers, HL has nearly 6 times the amount of AUM on its DTC platform than AJ Bell. HL has grown its share of the DTC market at 4.4% per year, compared to 17.8% per year for AJ Bell. This is even more impressive for AJ Bell because HL benefits from the compounding of asset values at a faster rate than AJ Bell and therefore a larger portion of its growth can be attributed to this effect. We also see HL’s market share stagnate in 2019, only managing to grow by 0.4% by 2022. In contrast, AJ Bell’s market share increases by 12.18% during the same period, a clear indication of the growing strength of its offering.
Barriers to Entry
Some of the companies mention that they operate in an industry with high barriers to entry. The reasons that they give to support this include the scale needed to reach profitability, complex regulatory requirements, technology, and the importance of having a trusted brand.
Entry and exit are good indicators of barriers to entry within an industry and both of these have been relatively subdued in recent years. A 2018 study by the FCA reported that three new firms had joined the UK platform market between 2012 and 2017, not a compelling number given the attractive returns on capital. Despite this, there are already a large number of investment platforms operating in the UK. Most of these however, were founded over 20 years ago, with HL over 40 years old, and AJ Bell nearly 30. This indicates that barriers to entry that weren’t present 20-30 years ago could be becoming more established, particularly those relating to scale and brand strength.
This trend is also exhibited in market share, another good indicator of barriers to entry. Whilst there were large changes in market share several years ago, this effect is less noticeable now with large providers such as HL and Abrdn exhibiting much more stable market share characteristics.
It is worth looking at some of the reported barriers to entry in more detail.
o Economies of scale – A 2019 report by the FCA reported a ‘weak negative relationship between average costs and scale’, suggesting that there are minimal scale advantages enjoyed by established platform providers. Despite this, all of the companies I have researched benefit from increased size, particularly in relation to staff costs. As platforms grow and the percentage of their revenue generated through ad valorem charges increases, the operating cost requirements are significantly reduced. This allows these platforms to reduce charges, creating barriers to entry for incoming firms.
o Technology – AJ Bell states that there is ‘significant investment required to create scalable and robust systems’. Whilst this is no doubt true, these are essentially the only fixed-cost investments required to enter the market and therefore don’t constitute significant barriers. Companies can also outsource the development of their platforms and incur the technology as a variable cost if they want to.
o Customer acquisition – People tend to rely on brand reputation when choosing an investment platform, with reviews and third-party websites forming a significant part of the process. Marketing is also an essential part of customer acquisition for platforms, with research showing that larger firms spend proportionally more than smaller firms, and significantly more in absolute terms. Barriers to entry related to customer acquisition are compounded by platform stickiness which makes it harder to draw existing customers away from their current platforms. This is supported by the high customer retention rates in the industry; 95% for AJ Bell &. 92% for HL.
o Regulatory requirements – Costs for regulatory requirements don’t appear to fall disproportionately on smaller firms and as such do not represent significant barriers to entry.
Competitive Advantages
AJ Bell has a number of competitive advantages that have enabled it to continue to take market share from other platform providers.
1. Low-cost – AJ Bell has made a name for itself as a low-cost platform provider. This gives it an advantage in the current ‘fee-conscious’ environment and has allowed it to maintain high levels of net inflows during periods of economic uncertainty. Its 0.25% platform fee is one of the lowest in the industry and is cheaper than HL at 0.45%, but generally more expensive than II’s fixed charge. AJ Bell has recently reduced a number of its fees, a move that should help to cement its market position.
2. Dual platform offering – Their dual platform offering provides them with a diversified source of revenue and allows them to take advantage of two important market trends; the movement of advised assets onto platforms and the increasing personal responsibility for individual finances.
3. Younger customer base – The average age for someone using AJ Bell’s DTC platform is 48. This is compared to an average age of 57 for the broader investment platform industry. This appeal to a younger demographic is likely the result of several factors including a higher proportion of DTC customers, a focus on making investing simple, and its low-fee structure. This is important because it gives AJ a higher customer LTV.
4. Easy to use platform – AJ Bell have always focused on making investing as easy as possible. They have invested significant capital in making their platform simple and intuitive and have now released new offerings on both their advised and DTC segments; each aimed at further removing barriers to investing.
5. Reputation – The strength of their brand gives them an advantage in terms of customer acquisition, with prospective customers more likely to choose a platform they know. They have also built credibility through certain awards and by being a Which? trusted provider. They have also built up credibility through third party reviews, which prospective customers often use when choosing a platform for the first time.
Risks
Here we will take a look at the operating risks for the company, the financial risks we will look at in more detail below.
1. Price competition erodes returns on capital – as mentioned previously, investment platform companies have very few ways in which they can differentiate their offerings. This could, and in some ways already is, lead to price competition between platform providers who have few other ways to appeal to customers.
2. Regulation changes impact investment and savings market – as discussed above, the structural tailwinds driving the growth of the savings and investment industry have been driven by regulatory changes such the personal pension. If these were to be amended by the government, or the tax rules changed, it could impact the demand for AJ Bell’s products. It is worth noting that I don’t think this would be the case given that the government benefits from people taking increased responsibility for the personal finances.
3. Behavioural changes affect the way individuals invest – platforms have become an attractive means of managing investments. They allow investors to consolidate their investments, provide access to a wide variety of different funds, and all for minimal cost. If a more attractive solution were to be developed, then platforms could be superseded. Investment by platform companies in new technology should help to mitigate some of this risk.
Valuation
I have valued AJ Bell using a DCF and three different scenarios.
AJ Bell is an interesting company to value because its revenue is split into three, very distinct categories. Firstly, ad valormen revenue is a function of the company’s net inflows and the market movements that are generated that year. Transactional charges can be viewed as a function of the number of customers, i.e. transactional charges per customer. Finally, recurring fixed, which are predominantly fixed pension fees in the company’s advised segment, have grown at a relatively stable rate and can therefore be forecast at a basic growth rate. Despite making the forecast of revenue highly complex, it does mean that every number is tied to its relevant driver and all of the assumptions are explicit.
The first is the base case and assumes they continue to take market share, but at a slightly slower rate than the current trend. It also assumes that margins improve slightly, in keeping with the current trend of improved operational efficiency. Reinvestment to fuel growth in this scenario is consistent with the previous years, tailing off as we reach the continuing value period.
The second scenario assumes that they continue to take market share, but at a slightly faster rate than historically. Margin expansion also happens at a slightly faster rate than in the base case scenario. Reinvestment in this scenario is higher than the base case, but rewarded with higher growth levels, and subsequently higher returns on capital in the explicit forecast period.
The final scenario assumes that the company suffers relatively significant net outflows and therefore loses market share. In this scenario the group reinvests to fuel growth that never materialises and therefore invested capital in the forecast years is reduced substantially. Margins also expand slightly to reflect reduced operating efficiency of lower revenues.
Using these three scenarios, and weighting them by various probabilities, we get to a fair value of £4.45. This is relatively close to the current price, so I don’t think it represents enough of a margin of safety to buy the company at this stage.
